Key Performance Indicators (KPI) is a report in the Jazzit financial statements. KPI includes ratios and amounts commonly used in financial statement analysis (indicators). The indicators are presented as graphs and/or tables.
Inserting the KPI report into the Jazzit financial statements
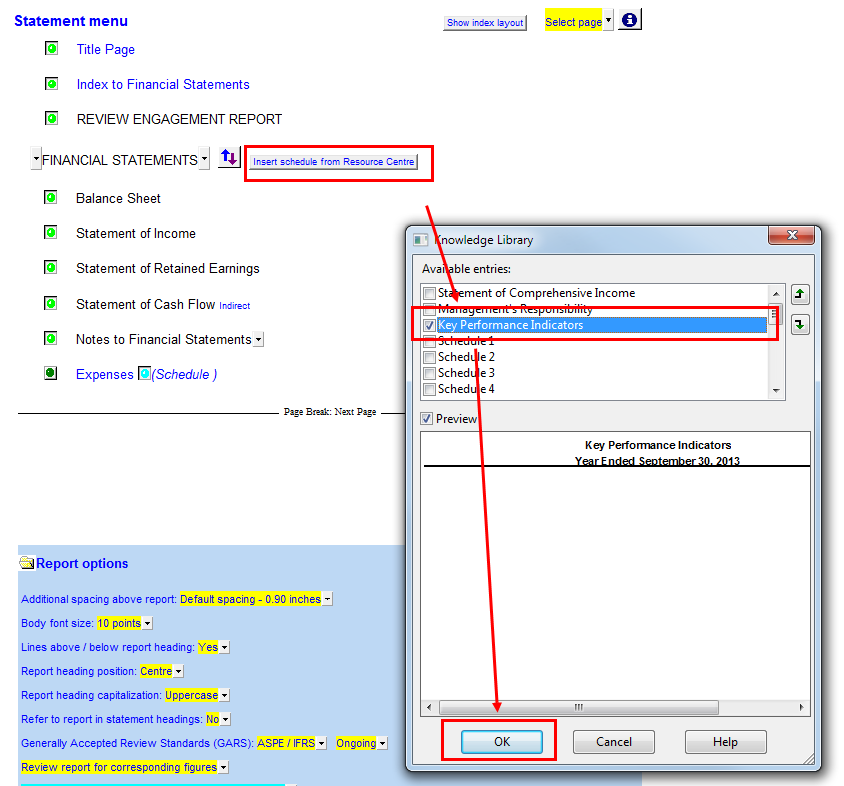
In the Jazzit financial statements, scroll to the Statement menu and click on the button entitled “Insert schedule from Resource Centre”, this will open the Knowledge Library window.
In the Knowledge Library window tick off the checkbox next to “Key Performance Indicators”. Click ‘OK’ and the KPI will be inserted at the bottom of the statements. Double-click on the KPI’s entry in the Statement menu to jump to it OR scroll down to the bottom of the statements.
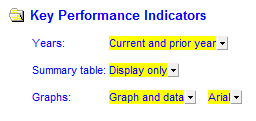
Key Performance Indicators – global settings
The global settings for KPI are located near the top of the report. Click on the small folder next “Key Performance Indicators” to reveal or hide these settings.
- Years – Choose the numbers of years to display in the entire report. The KPI can display up to 5 years.
- Summary table – This controls the print settings for the Analytic Summary section. If you need the Analytic Summary to show up in print, select “Display and print” otherwise select “Display”.
- Graphs – This setting affects the presentation of all indicator graphs. Choose whether to display the Graph or Data or Both. This setting can be set for individual indicators (see Indicator Graphs). The display font for the indicators is set here as well.
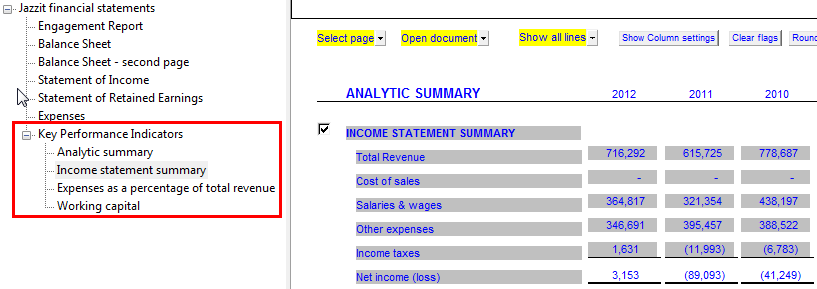
Analytic Summary
The Analytic Summary lists the indicators available. The indicators can be skipped individually using the checkboxes to the very left.
The indicators have corresponding graphs that appear on subsequent pages of the report. The checkboxes to the right (Graphs column) control whether the indicator’s graph will display in those subsequent pages. Using the buttons ‘C’ or ‘S’ will clear or activate all checkboxes in the Graphs column.
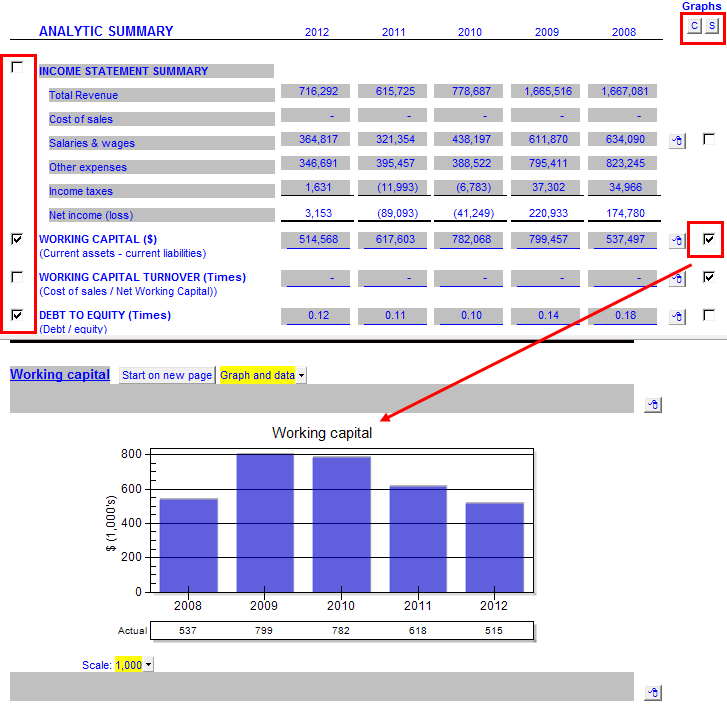
Note: If an indicator is disabled using the left checkbox, its corresponding graph will be hidden even if the Graph checkbox has been checked off.
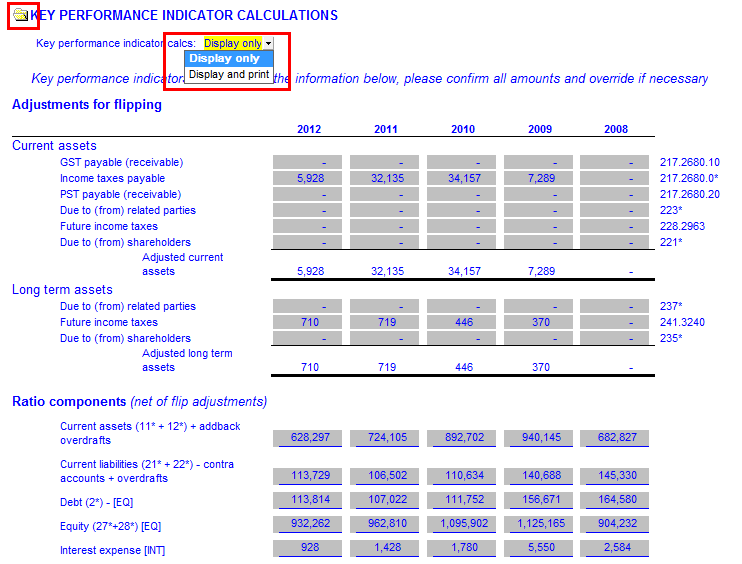
Key Performance Indicator Calculations.
The underlying ratio components can be found in the Key Performance Indicator Calculations (KPIC) section. The individual components can be overridden if required. KPIC is hidden/revealed by clicking in the folder next to the KPIC heading. This section can be set to print/skip by using the dropdown shown below.
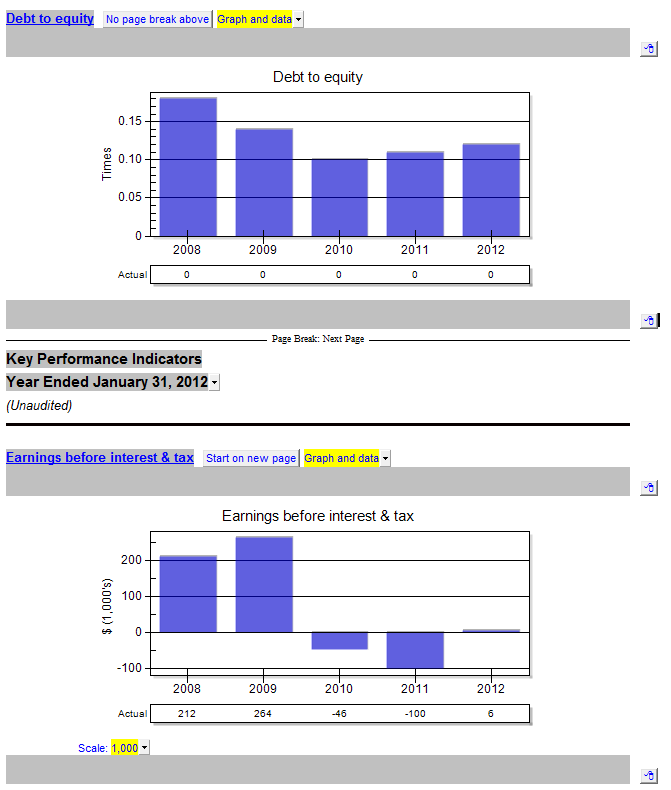
Indicator Graphs
All indicators in the Analytic Summary (except gross profit $) will have a corresponding table/graph in subsequent pages of the report. Each table and graph section has its own set of display options.
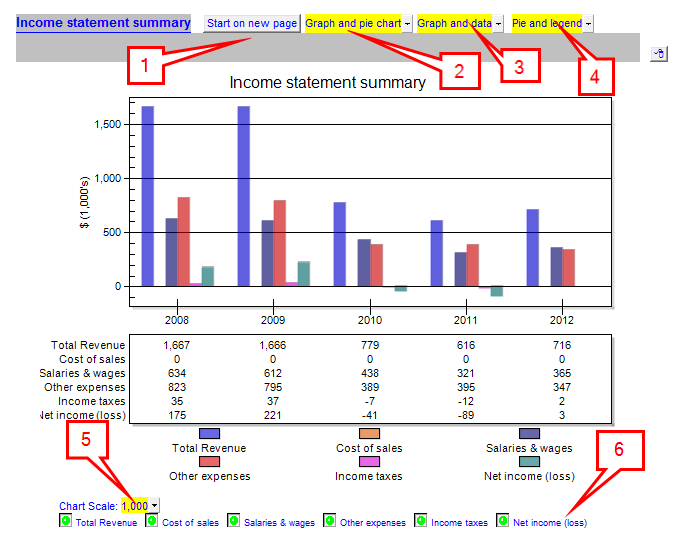
- Start on new page/No page break above – Use this button to toggle on/off a page break above the graph.
- Graph and pie chart (Income statement summary only) – Set to display only graph, pie chart or both.
- Graph and data - This setting affects the presentation of individual indicator graphs. Choose whether to display either Graph or Data or Both. This setting will overrule the global setting of the same name (see Key Performance Indicators – Global settings)
- Pie and legend (Income statement summary only) – Choose whether the Pie chart displays by itself or with an accompanying legend.
- Scale – Set the graph’s scale
- Table/Graph buttons (Income statement summary only) – Buttons underneath both the graph and pie charts allow you to include or exclude income statement categories.
Navigating the KPI using document map
If the Document Map is enabled, it can be used to quickly move between various indicators and sections. Document map can be accessed via View > Document Mapping. If you don’t see the proper tags in the document mapping, you will need to update the template.